I have read through all the log files you have posted, and nowhere in them have I seen an API request indicating that the frontend has initiated the export log task on the backend.
In order for us to diagnose what is happening, please do that single task, once you see the problematic behaviour, send us the logs just for that.
At the moment, all I am seeing is the Redis warnings about the no maxmemory policy, and when you have run the export task manually from the command line.
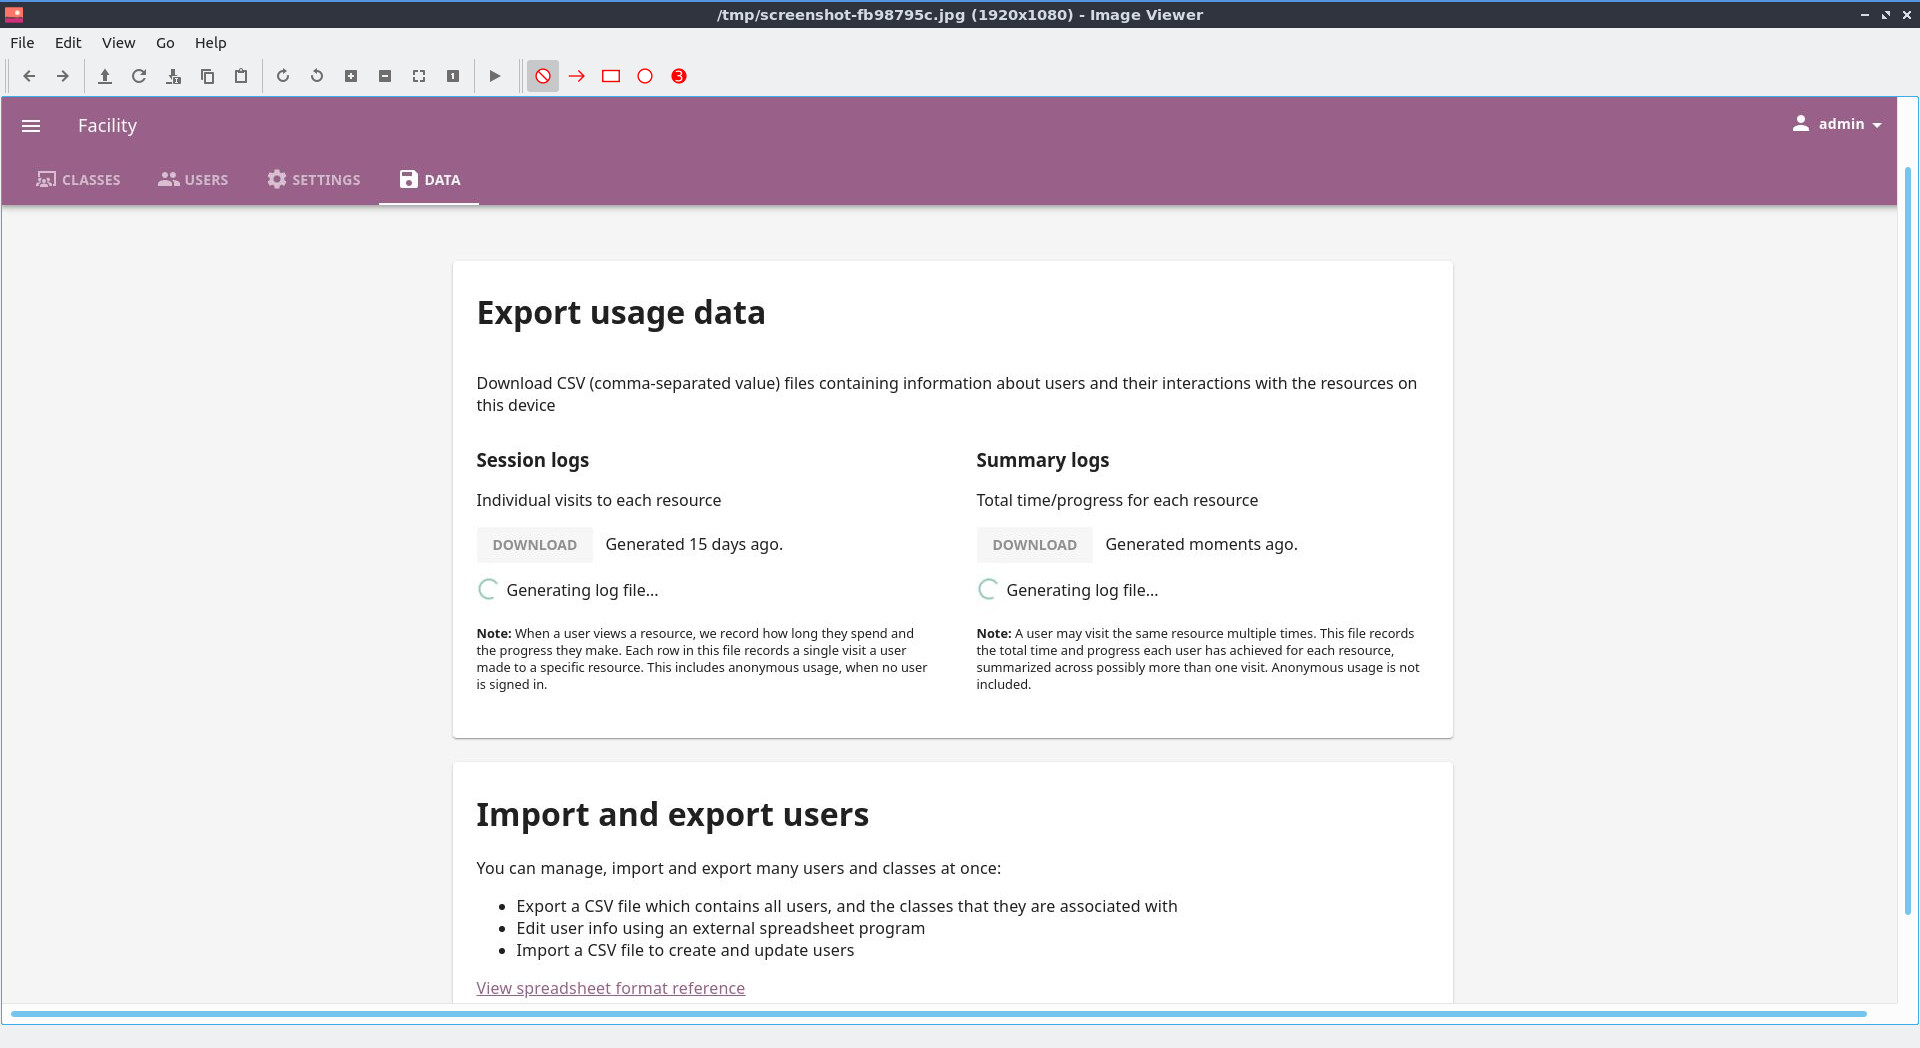
I also didnt see any errors in the logs that is obvious and pointing to any specific issue relating to the csv logs. However, the screenshot that I shared with you is all that it is showing. I’m not sure what you want me to send to you or what would you like me to do? I have initiated the “Generate Log file” button and afterwards sent you the logs.
Can you be a bit more precise on what you would prefer me to do or I will make a video clip and share that with you.
Thanks @Bryan_Fisher - I think I understand what is happening here - the weird /api/ calls seem to be significant here, I believe that something strange is happening when trying to check for the existence of the file. I’ll dig into it more and get back to you.
Had another look, and I can’t see how the behaviour you are seeing is occurring.
To help further diagnose the issue, it would be useful to see your Nginx configuration, and also if you could export the HAR file from the network tab in Chrome while you are doing this.
Open a tab in Chrome web browser and navigate to the facility page.
Open the developer tools (as you did to take the screenshot), either by pressing F12 or going to the menu and selecting More Tools → Developer Tools.
Click on the ‘Network’ tab within the developer tools. It should look something like this
Initiate the log export again. And once the bug replicates, export the HAR file by clicking this icon.
This will export the requests made when interacting with this specific page, and download them to a file. This will only contain information about network requests made while the developer tools were open.
Please link the file here and the nginx configration for me to examine.
Looking at the HAR file - the only thing I am seeing in there that is indicative of why a failure is happening is that during the export summary log task, there is an error connecting to the Redis server.
I think that seems like the prime place to look, as we have already had some indications that Redis may be misconfigured. I would address the warnings you are seeing when Kolibri starts with regards to Redis to see if that can help resolve this.
I am unsure where the erroneous calls to /api/ are coming from based on this HAR file - they do not seem to be generated by the browser. Is there anything else that might be making this query?
The nginx configuration you sent me seems to be the generic configuration, and not the one specifically for Kolibri. I don’t think it’s necessary, but just flagging that there was not anything diagnostic in that base file.
I will have a look at the Redid server. After updating to kolibri 0.14.6 & 0.14.7 version, the calls to /api/ is happening on all our Kolibri instances, the difference with this one is that it is giving this issue with the CSV Logs. The other instances don’t give an issue.
Thanks, let me know how the Redis settings pan out. As I mentioned, there was an error connecting to Redis during the export task, so this would be why it’s specific to this server.
If you see any other indications about where the calls to /api/ are coming from, I’d be interested to know!
Hi @richard, I’m battling to get the error that you pointed out with redis resolved. I have opted to update kolibri-server from 0.3.6 → kolibri-server 0.3.8 Beta.
Hi @richard Please find the latest kolibri.txt file attched: After installing kolibri-server 0.3.8 Beta, I deleted the .data_version file and rebooted the server. Now th database is locked.
Hi @richard This kolibri instance is attached to a Postgresql DB and is still doing this “Generating log file…”
At first, it was working fine. We spent two full days just going through lessons creating users etc then this happened again. It only becomes an issue after the system is in use the database starts acting up. Please let me know if there anything you can advise that i should do to resolve this problem.
kolibri & Kolibri-server is installed on this server and it ws installed via .deb file. I have moved from SQlite DB to Postgresql, that is why you are not seing the previous message. After moving to Postgresql it was workng well for a few days.
Then I try to import some content and it did not succeed, I cant remember what that error was but I just moved on from there, but did not succeed with a solution.
After the few days I tried generating a log file and I was faced with the same issue “Generating log file…” Please note it was WORKING after migrating to postgresql. After a while using the system the problem arose again.
We currently have x4 Centre now that is experiencing this same issue wether it is sqlite or postgresql db.
Please let me know if there a solution that i can test, or troubleshooting steps that can follow and send to you.
The issue I am seeing in the logs is specific to SQLite - it is trying to update the progress of the task, and instead is finding that the SQLite database for recording progress about the jobs is locked.
This is most likely a result of multiple task runners running simultaneously, and both trying to access the jobs database.
To diagnose further, could you ensure that Kolibri is completely stopped, and then try running the export logs management command from the command line:
kolibri manage exportlogs <....arguments>
See the file linked above for the command line arguments that should be passed. If this works, then there is something happening during the task execution that is problematic.
The next thing to check is how many processes are running when accessing the task database - one possibility is that we might need to raise the SQLite timeout (the time that SQLite takes before giving up on trying to write to a locked DB).
To check the above, start Kolibri, run the export task, and do:
fuser <path to kolibri home>/job_storage.sqlite3
in a terminal when the error occurs - this hopefully should show which process is locking the SQLite file.